Q3 24 dividend portfolio review: cash yield up 25% YTD + I'm beating the (wrong) benchmark!
Dividend income from my model portfolio has surged ahead this year, but capital gains have lagged the FTSE 100. I consider what might be happening and discuss two recent changes to the portfolio.

The dividend income received from my model portfolio has rose by 25% during the first nine months of 2024, compared to the same period last year.
To be transparent, these payouts have been helped by factors including changes to the portfolio, special dividends, and one-off increases.
I don't expect this rate of growth to continue. But I do think this is a useful demonstration of the stable cash returns dividend income can provide, against a background of market uncertainty and share price volatility.
My main goal with this model portfolio and my matching personal portfolio is to provide dividend growth with a yield above the market average, which I take as the FTSE 100 yield (currently 3.6%).
If I can achieve this over a long-enough timescale, then in theory, proportionate capital gains should follow, as the market reprices my stocks to reflect the increased level of income they provide.
There's no guarantee of this, of course. So-called dividend traps can provide high yields while destroying shareholder value (and share prices) in the background.
Over the last couple of years, the impact of rising interest rates has also distorted this process (or perhaps I've just picked some duff stocks!).
Certainly, the portfolio's capital performance has lagged badly behind its income growth since 2022.
Despite this, I'm still confident in the theory behind my approach. I'm also broadly reassured by the growing – and I believe sustainable – stream of surplus cash provided by the companies in my portfolio.
While a few of my companies have faced specific setbacks this year, the majority have performed broadly as expected, supporting a pleasant improvement in cash income:
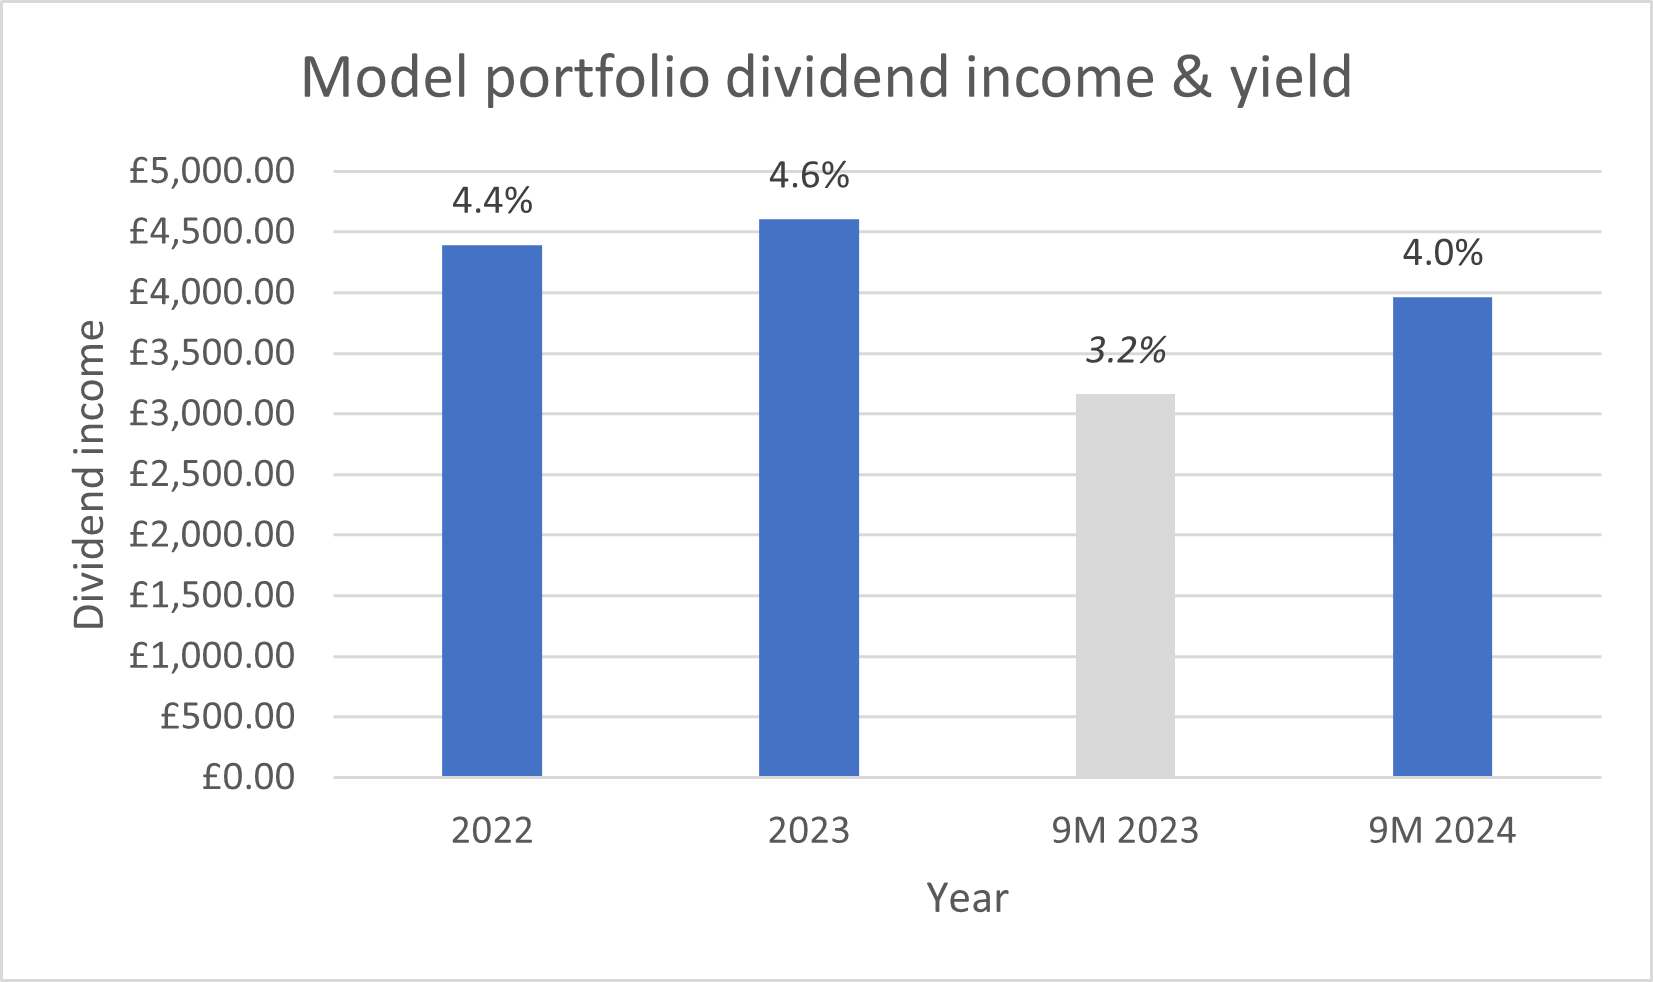
The model portfolio received £1,215 in dividend income during the third quarter, based on ex-dividend dates during the period.
This lifted nine-month dividend income to £3,965. That's equivalent to a yield of 4% on the portfolio's original £100k of virtual capital.
Read on for a more detailed review of the portfolio's performance in Q3, including details of two changes I've made to the portfolio.
- Q3 2024 portfolio performance review
- Portfolio changes in Q3 2024
- Position weightings
- Key financial metrics for the portfolio
- Final thoughts
Q3 2024 portfolio performance review
Total return from the portfolio was slightly negative in Q3, as falling share prices offset dividend income.
Q3 2024 performance:
- RH model portfolio total return: -1.1%
- FTSE 100 TR: 1.8%
Here's how share prices within the portfolio moved around during Q3:
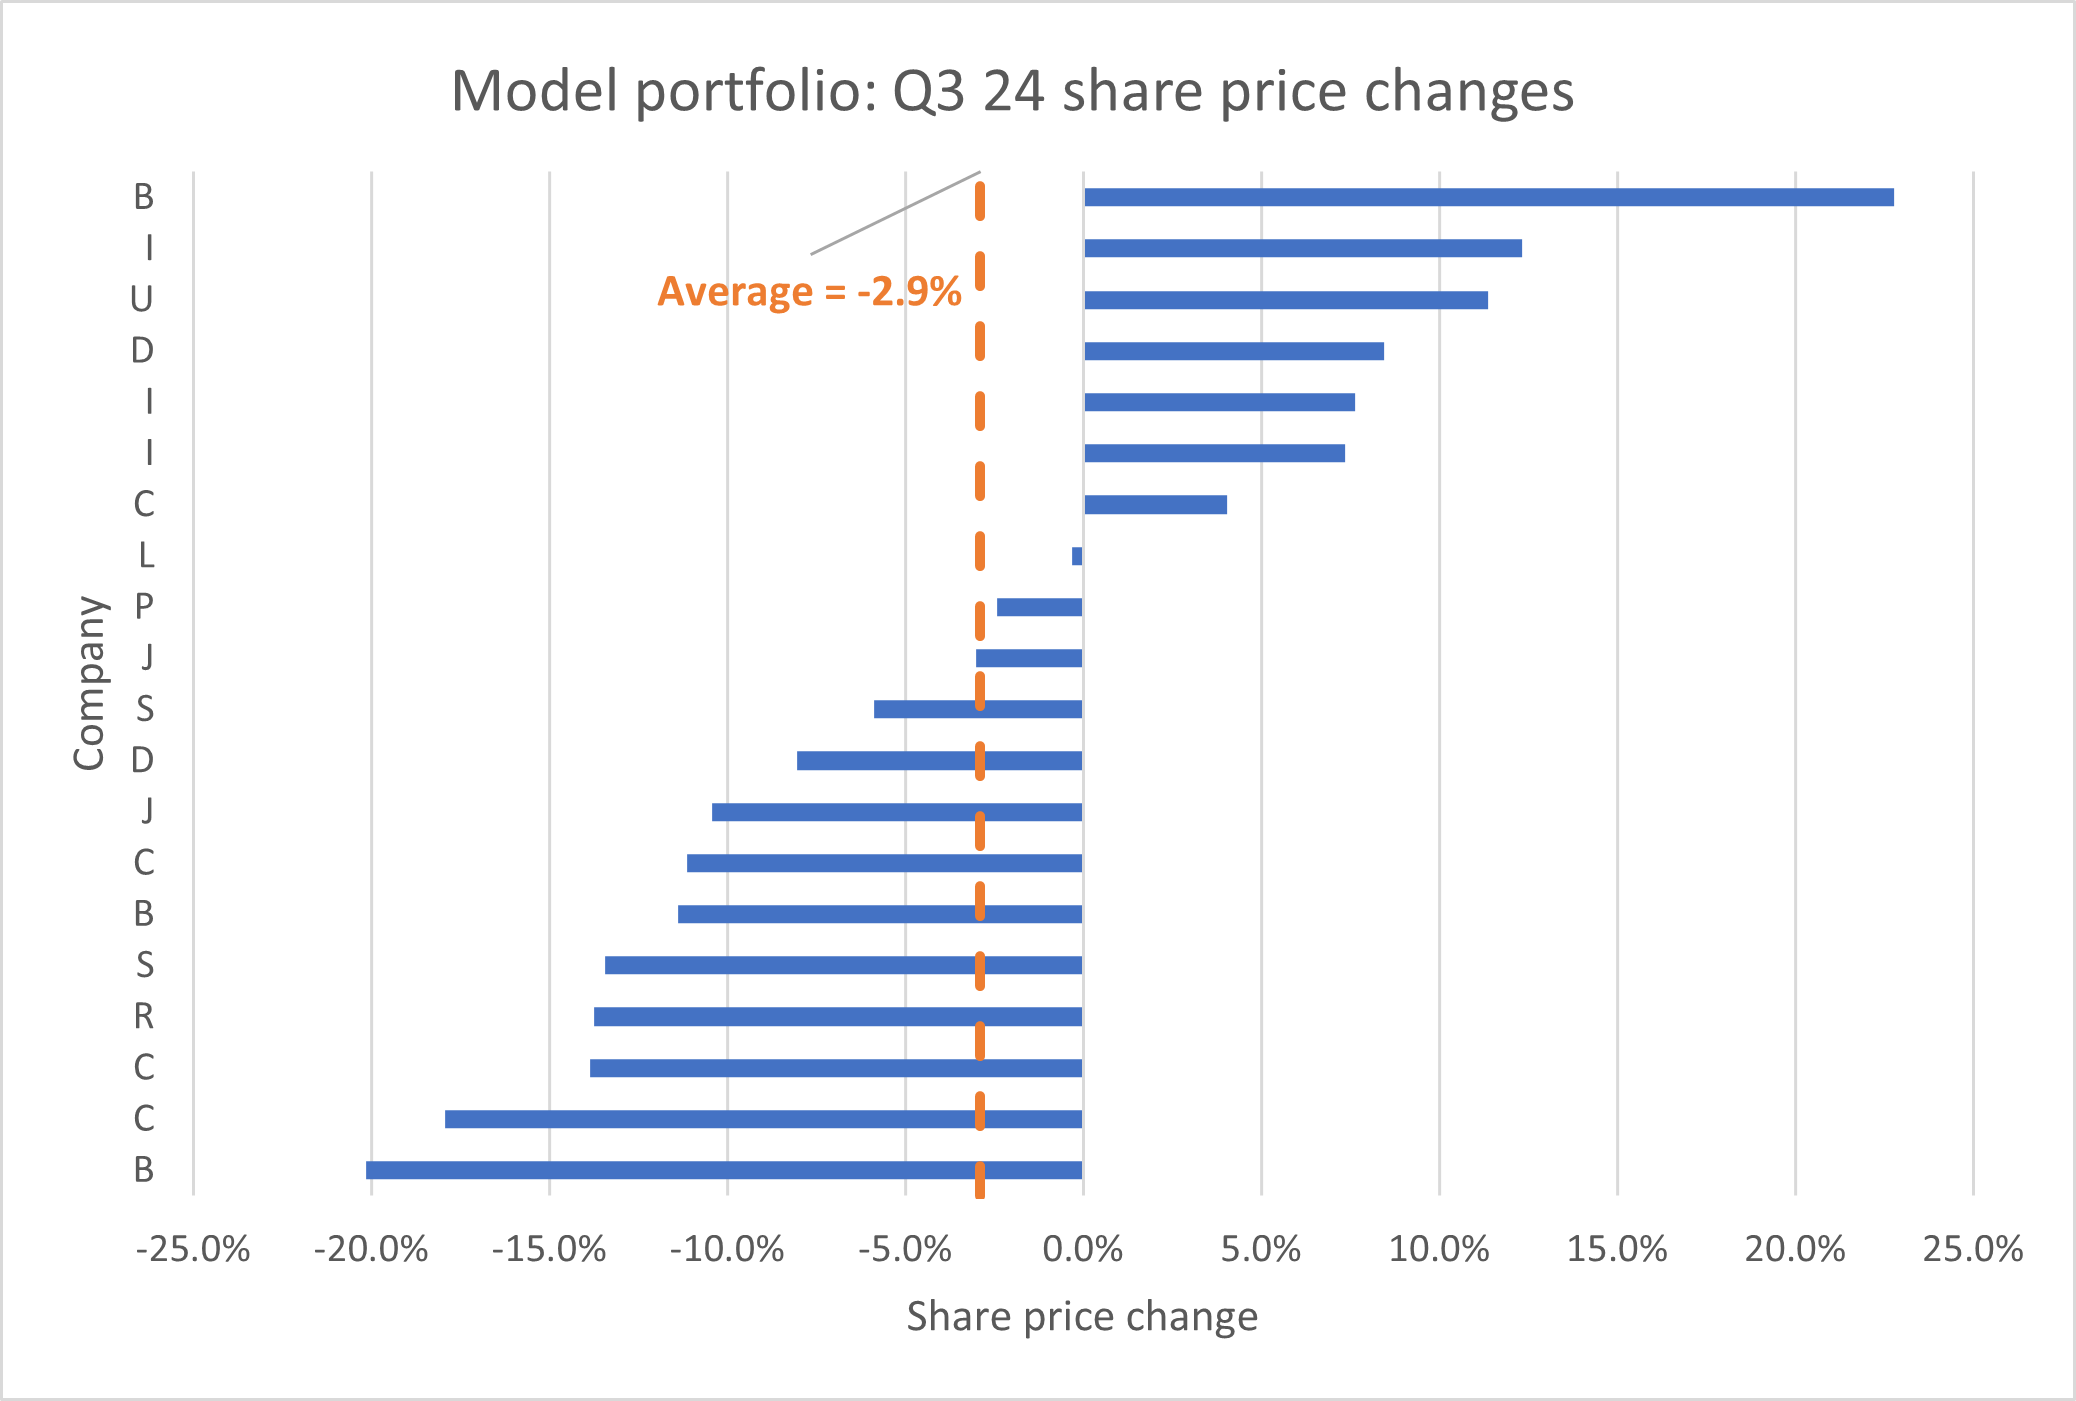
The biggest faller here – 'B' – has also suspended its dividend this year. I believe this business can recover. But I'm awaiting results and a strategy update from the new CEO later this year, before making any further judgement. For now, the holding remains under review.
2024 YTD performance: larger gains for the FTSE 100 during the first half of this year mean that the portfolio's nine-month performance is somewhat worse than the Q3 numbers:
- YTD RH model portfolio total return: -1.1%
- YTD FTSE 100 TR: 9.9%
Finally, here's how the portfolio has performed against the FTSE 100 Total Return index since its inception in December 2021:
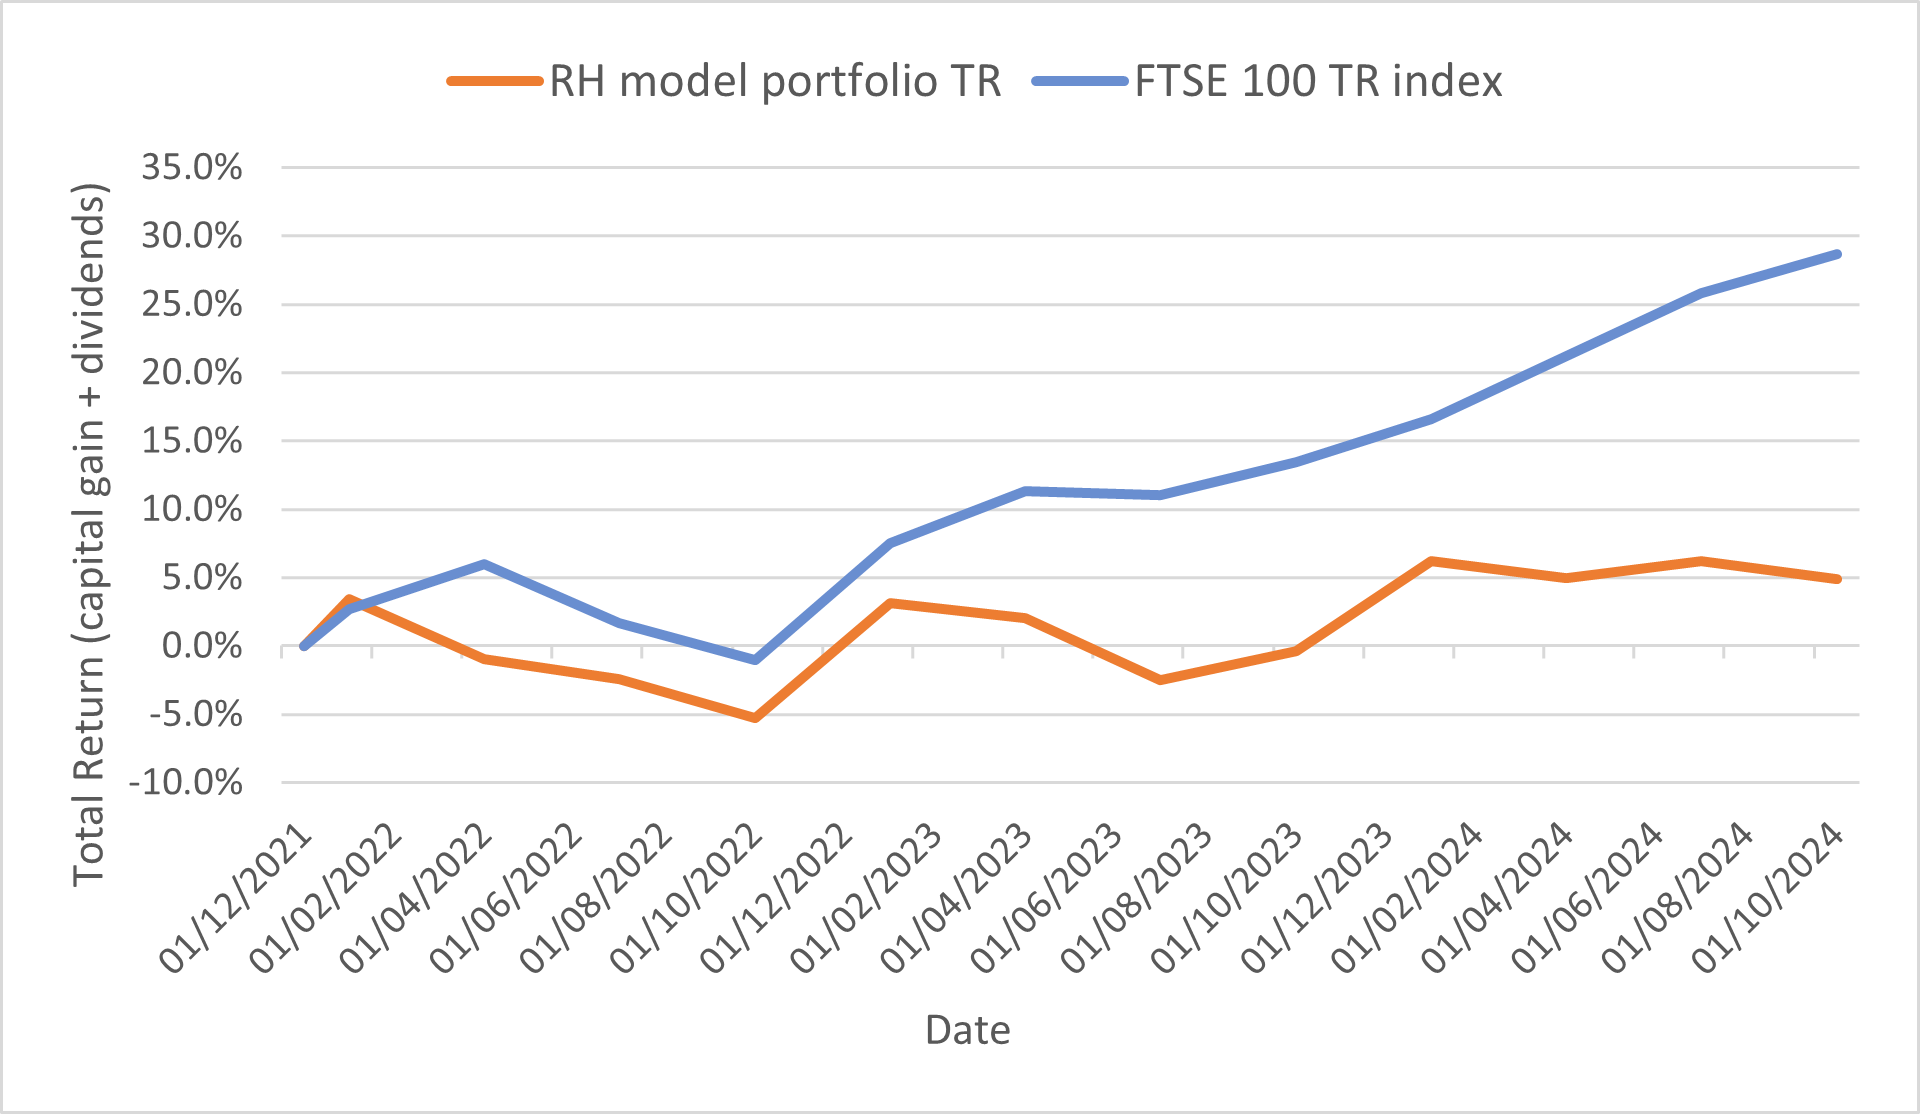
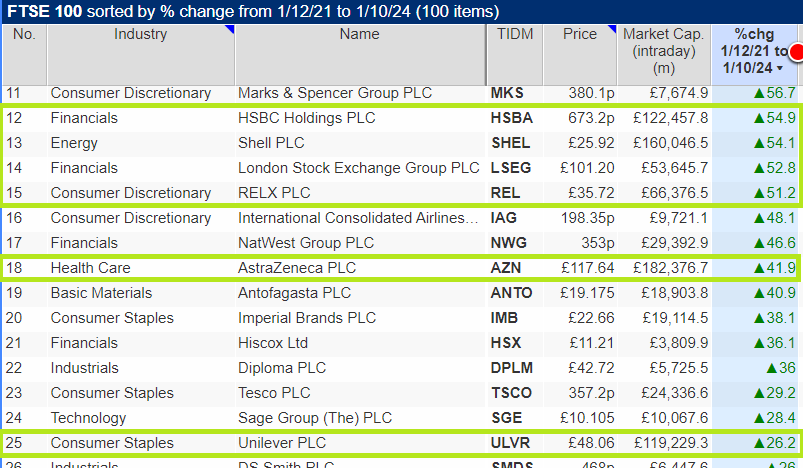
During this period, the market-cap weighted FTSE 100 index has been lifted by big gains for a handful of its largest companies – most of which I don't own (except Unilever):
FTSE 100 vs FTSE 250: have I chosen the wrong benchmark?
I may have chosen an unfortunate time to launch an all-cap portfolio benchmarked against the FTSE 100.
My model portfolio contains 20 stocks, split roughly equally across the FTSE 100, FTSE 250 and SmallCap/AIM markets.
For most of the last 20 years, the FTSE 250 and FTSE SmallCap indices have reliably outperformed the big cap FTSE 100.
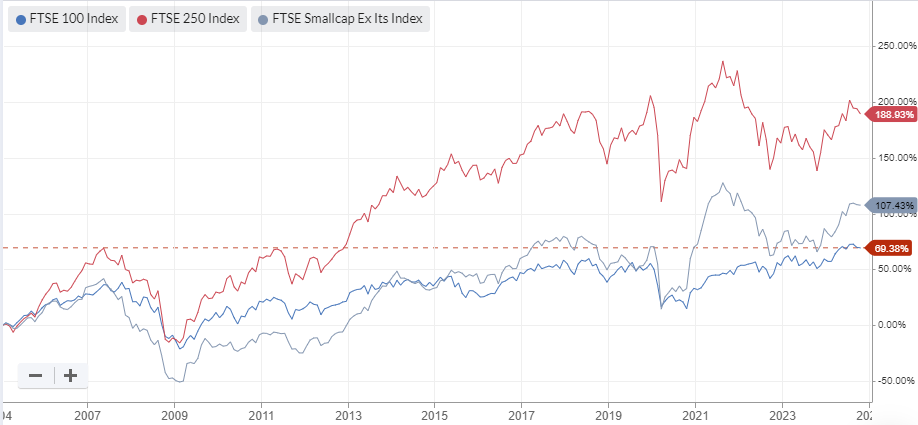
However, over the last five years, the FTSE 100 has gained the upper hand.
Since I launched my model dividend portfolio in December 2021, the big cap index has seemingly gained a new lease of life, outperforming the FTSE 250 by more than 20% (excluding dividends).
As a result, the model portfolio's small/mid-cap bias may have worked against me:
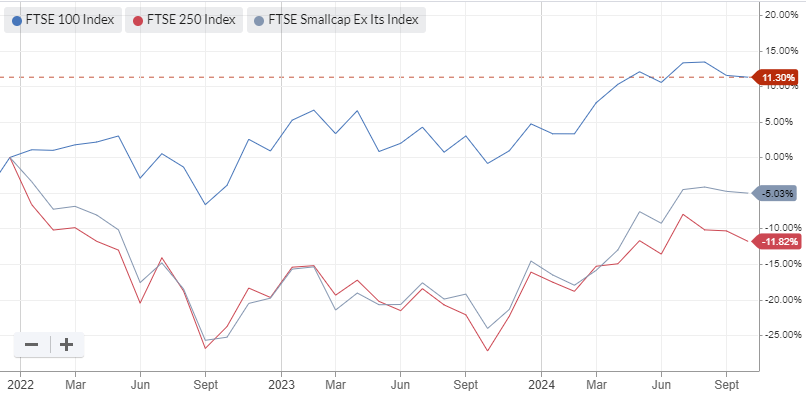
It is perhaps cold comfort, but my model portfolio has outperformed the FTSE 250 Total Return index since inception, according to SharePad data:

The problem is that the FTSE 250 TR is not my benchmark. As a lower-yielding index, choosing it as a benchmark for a high yield portfolio would be illogical.
I remain hopeful that over time, my stock selections will also outperform the FTSE 100.
In the meantime, I'm continuing to focus the portfolio on quality income opportunities with the potential to compound over time.
However, I'm also allowing myself a little more leeway to trade more cyclical dividend stocks that might not suit long-term holding periods.
Portfolio changes in Q3 2024
My slow trading policy allows me to make up to two changes to the model dividend portfolio at the end of each quarter.
During the third quarter I opted to max out this policy and replaced two shares in the portfolio.
Stocks sold in Q3
September 2024: I sold two stocks at the end of September. I shared the details with subscribers in my monthly review for September, but here's a quick summary of the two companies I decided to leave behind.
Bellway (LON:BWY): this FTSE 250 housebuilder is one of the best quality companies in this sector, in my view, with a long record of (cyclical) growth. But the share price looks up with events to me now, potentially pricing in several more years of recovering earnings.
I may have sold Bellway too soon. But the stock is now trading at a premium to its book value and its dividend yield has fallen below 2%.
Given this, I think the balance of risk and reward has changed since I added the shares to the model portfolio at £17 in September 2022.
I sold on 30 September 2024 to realise a total return of 97%, equivalent to 40% annualised.
PZ Cussons (LON:PZC): my investment in this consumer goods firm has been considerably less successful.
PZ Cussons' balance sheet was gutted last year by £140m of currency devaluation losses on cash held in Nigeria.
Profits slumped too, even on an adjusted basis, and the underlying sales performance of the group's brands has also been somewhat mixed.
I believe PZC shares could theoretically be cheap, but I think there's also a meaningful risk things could get worse for shareholders. Certainly, I think the company's dividend payment capacity is likely to be reduced for the foreseeable future.
I sold PZ Cussons on 30 September for a total loss of 44%, equivalent to -18% annualised.
New stocks in Q3
September 2024: I added two new shares to the portfolio to replace Bellway and PZ Cussons.
Both are small caps with high yields, cash-rich balance sheets and a long records of paying attractive dividends.
One of the new shares is listed on London's Main Market, while the other is an AIM stock.
I'm conscious of the risks relating to the uncertainty over AIM IHT relief ahead of October's budget, but I don't believe in letting the tax tail wag the investment dog.
In addition, I think the company in question is probably cheap enough to offset some of the risk of short-term volatility. This particular AIM share currently trades at an attractive discount to book value, with a sizeable net cash balance.
I published a full write-ups of these new purchases for subscribers here:
- New stock #1: a respected specialist with a 7% dividend yield
- New stock #2: 20 years of dividend growth & a 6% yield
Both trades were made on 30 September 2024, the final trading day in the quarter.
Position weightings
Model portfolio positions are all opened with a default sizing equivalent to about 4.7% of the original portfolio capital. Occasionally I make top ups, although there haven't been any yet in 2024.
Here's how the model portfolio looked at the start of October 2024, after the transactions discussed above. Subscribers can see this chart with ticker codes included on my portfolio page:
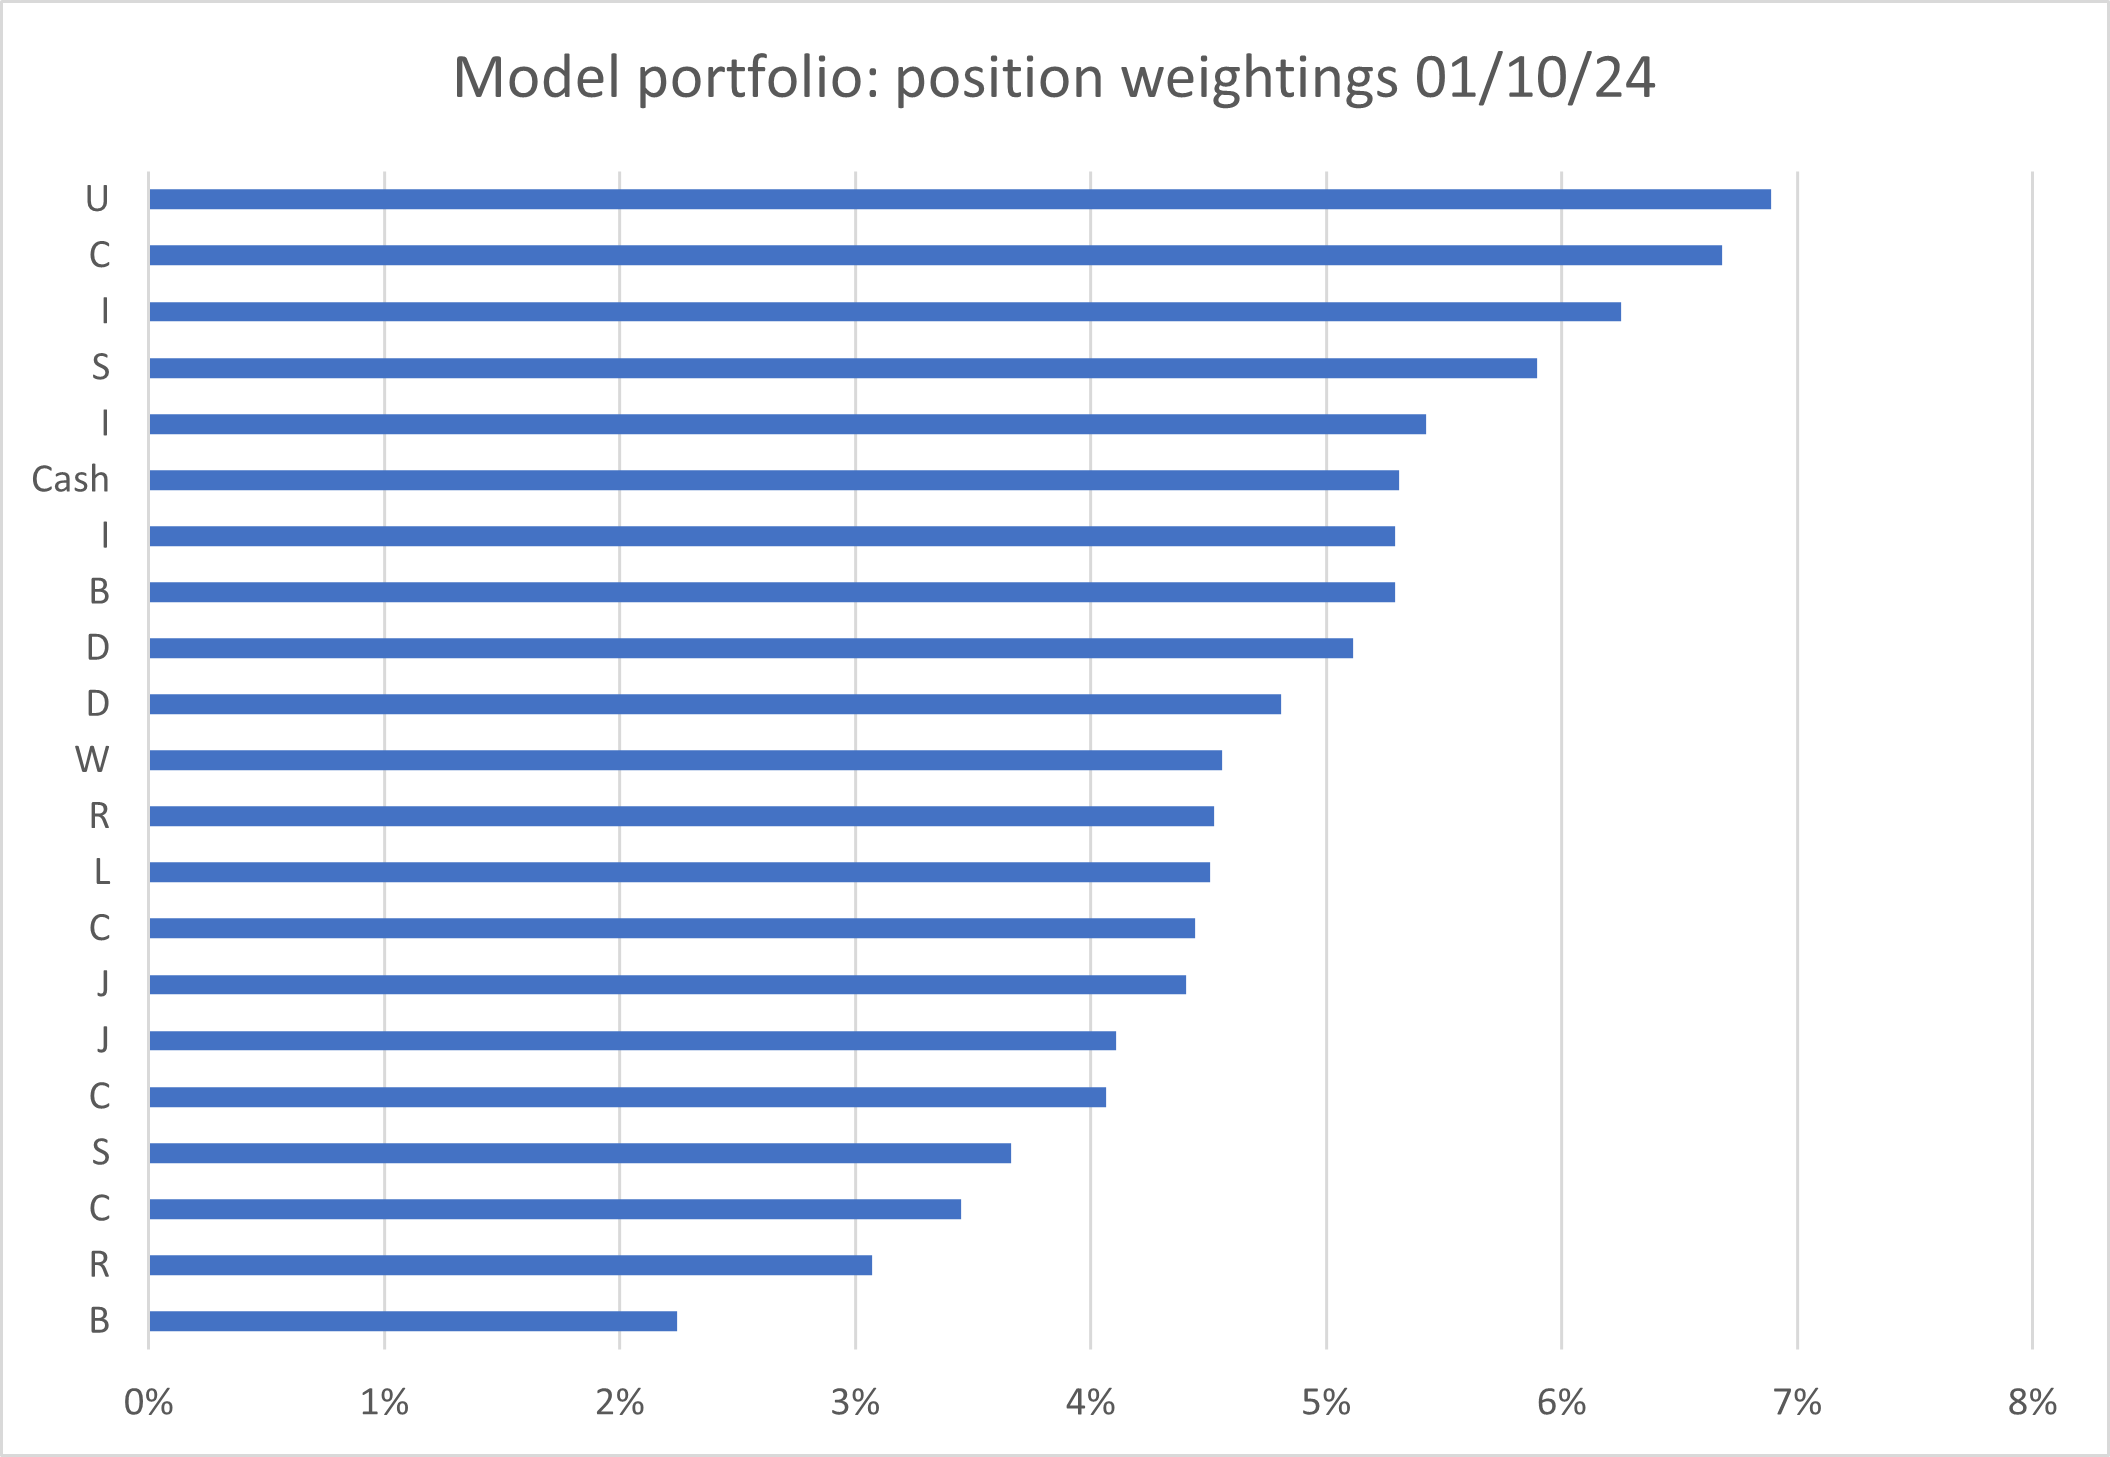
As a rule of thumb, I aim for cash to be between about 4% and 8%. With cash now in excess of 5%, I may consider topping up some of the portfolio's positions at the end of this year or in Q1 2025, when further dividends should have been received.
I don't have any limits on position sizing, but any holding dropping towards 2% is likely to be under review (e.g. 'B' – discussed earlier). Equally, if a holding rose above 10%, I might take a fresh look at the situation.
Model dividend portfolio: key financial metrics
There's no such thing as the perfect stock. But a number of companies with attractive characteristics can be combined to create a portfolio with near-perfect financial metrics.
Of course, an attractive average can conceal many less appealing stock-specific metrics. Each investor's definition of perfection is also likely to vary.
Even so, I like to use this whole-portfolio approach as a way of checking that the shares I'm buying are – in aggregate – following my strategy.
Some examples of the qualities I'm looking for include:
- FTSE-beating portfolio dividend yield
- dividends covered by free cash flow
- reasonable valuation, leaning towards value
- above-average profitability
- long track record of unbroken dividend payouts
- target annual return of 10%, calculated as dividend yield + expected dividend growth
At the end of each quarter, I calculate portfolio averages for each of the measures below. Here's how things looked at the end of September:
| Median mkt cap |
TTM ROCE | TTM EBIT yield |
TTM FCF yield |
Net debt/5yr avg net profit |
TTM div yield |
5yr avg div grth |
F'cast div yield |
No. yrs div paid |
| £1.7bn | 22.7% | 10.3% | 8.8% | -0.1x | 5.5% | 6.7% | 5.0% | 24 |
Scroll L-R (Data source: SharePad/author analysis 01/10/2024. Some adjustments were needed, e.g. for financial stocks. Please DYOR and don't take this as gospel.)
Here's how these statistics looked at the end of H1 2024
The biggest change over the last quarter was probably the reduction in median market cap from £2.7bn to £1.7bn. This primarily reflects the sale of Bellway and PZ Cussons and their replacement with two small caps.
Moving along, my trailing valuation metrics EBIT yield and FCF yield have both improved (got cheaper) since the end of June, when the equivalent figures were 9.1% and 6.9%. This reflects a combination of falling share prices and the valuations of the new stocks I've added to replace Bellway and PZ Cussons.
Both of these metrics are now squarely in value territory, in my opinion, assuming the company profits which underly them remain broadly sustainable.
Happily, profitability across the portfolio remains excellent. The average return on capital employed (ROCE) at the end of Q3 was 22.7%, up from 21.5% at the end of H1.
My portfolio companies also have a small aggregate net cash position and have paid dividends for an average of 24 years.
Perhaps the only potential concern highlighted by this table is that the portfolio's trailing dividend yield of 5.5% is lower than its forecast dividend yield of 5%.
This implies that the level of income received over the last 12 months could fall and is at odds with the portfolio's five-year average dividend growth of 6.7%.
I can't rule out the risk of dividend cuts. But there are also a couple of other contributing factors:
- The portfolio has received several special dividends over the last year. These may not be repeated;
- One of the stocks in the portfolio has suspended its dividend.
Final thoughts
I cannot be entirely happy about the portfolio's total return lagging the FTSE 100 by so much. But I am pleased by the portfolio's continuing cash income generation.
The widespread underperformance of UK mid caps and small caps may reverse if the Autumn Budget provides the supportive clarity businesses are hoping for. Equally, it could persist, especially if the domestic economy slows, or if Budget changes are unfavourable to investors.
Risk and uncertainty are permanent in the stock market. But I continue to believe that holding well-established businesses with strong profitability, good cash generation and a long record of dividends is a sensible – if unexciting – strategy.
Until next time, thank you for reading – and good luck in the markets!
Roland Head
Disclaimer
This is a personal blog/newsletter and I am not a financial adviser. All content is provided for information and educational purposes only. Nothing I say should be interpreted as investing advice or recommendations.
You should carry out your own research and make your own investing decisions. Investors who are not able to do this should seek qualified financial advice. Reasonable efforts are made to ensure that information provided is correct at the time of publication, but no guarantee is implied or provided. Information can change at any time and past articles are not updated.


