Q3 2023 review: buying shares and looking ahead
The third quarter saw me add two new stocks to my quality dividend portfolio, which remains on track to deliver a 5.5% yield this year.

Welcome to my latest quarterly review. This update will look at the portfolio's overall performance during the third quarter of 2023.
Subscribers receive detailed monthly reviews of individual company results – this update looks at the portfolio as a whole.
I've used the last three months to make some changes to my portfolio, which I discuss below. I've replaced two shares, making all the transactions at the end of the quarter in keeping with my slow trading policy.
I'm currently mulling over one further change for this year, but haven't yet made a final decision. If I do decide to go ahead, I'll write it up here for subscribers beforehand.
Q3 2023 portfolio performance
The portfolio I'm discussing here is my quality dividend model portfolio, which is run using my dividend screening system.
This model portfolio was launched on 1 December 2021. It contains largely the same shares as my personal portfolio, which has been run on a similar basis for a number of years.
Here are the performance figures for the third quarter and first nine months of 2023.
Q3 2023:
- Dividend portfolio total return: +2.1% (including 1% dividend income)
- FTSE 100 Total Return index: +2.2% (including 1.2% dividend income)
9M 2023:
- Dividend portfolio total return: -3.4% (including 3.7% dividend income)
- FTSE 100 Total Return index: +5.5% (including 3.4% dividend income)
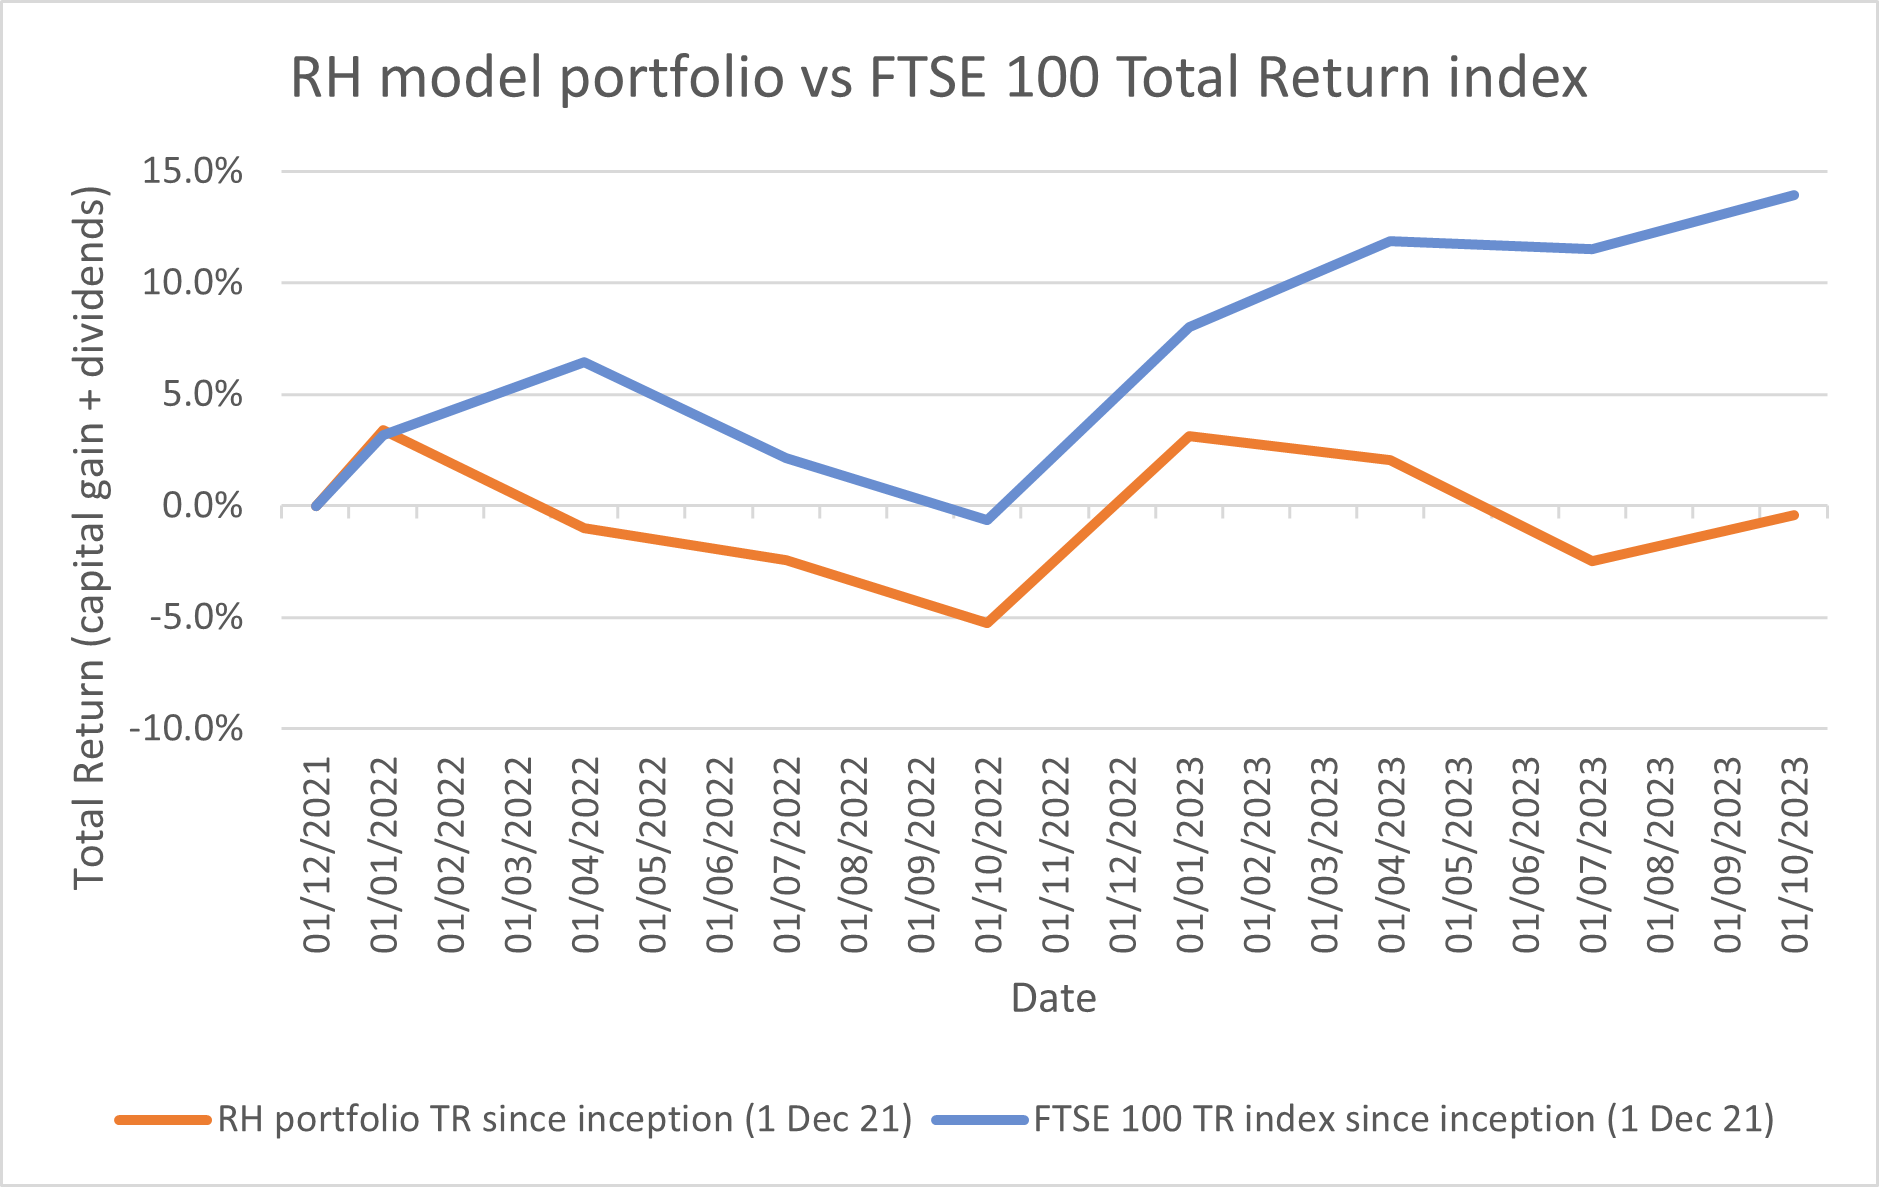
This chart shows the portfolio's performance against the FTSE 100 Total Return index since the model portfolio's inception on 1 December 2021.
Both lines show total return (capital return + dividends):

I'm glad that the model portfolio has returned to breakeven from its starting point in December 2021. But there's no avoiding the fact that so far, I would have done better to invest the model portfolio in a cheap FTSE 100 tracker fund.
I could make all the obvious excuses – war, oil prices, small-cap exposure, inflation, etc – but I think the reality is that it's too soon to be sure whether my approach will pay off.
As I'll explain below, I believe my portfolio contains companies that are above-average quality and (mostly) reasonably valued. Over long periods, I hope they'll outperform the index. But there's no guarantee of this, and I may simply have chosen the wrong stocks.
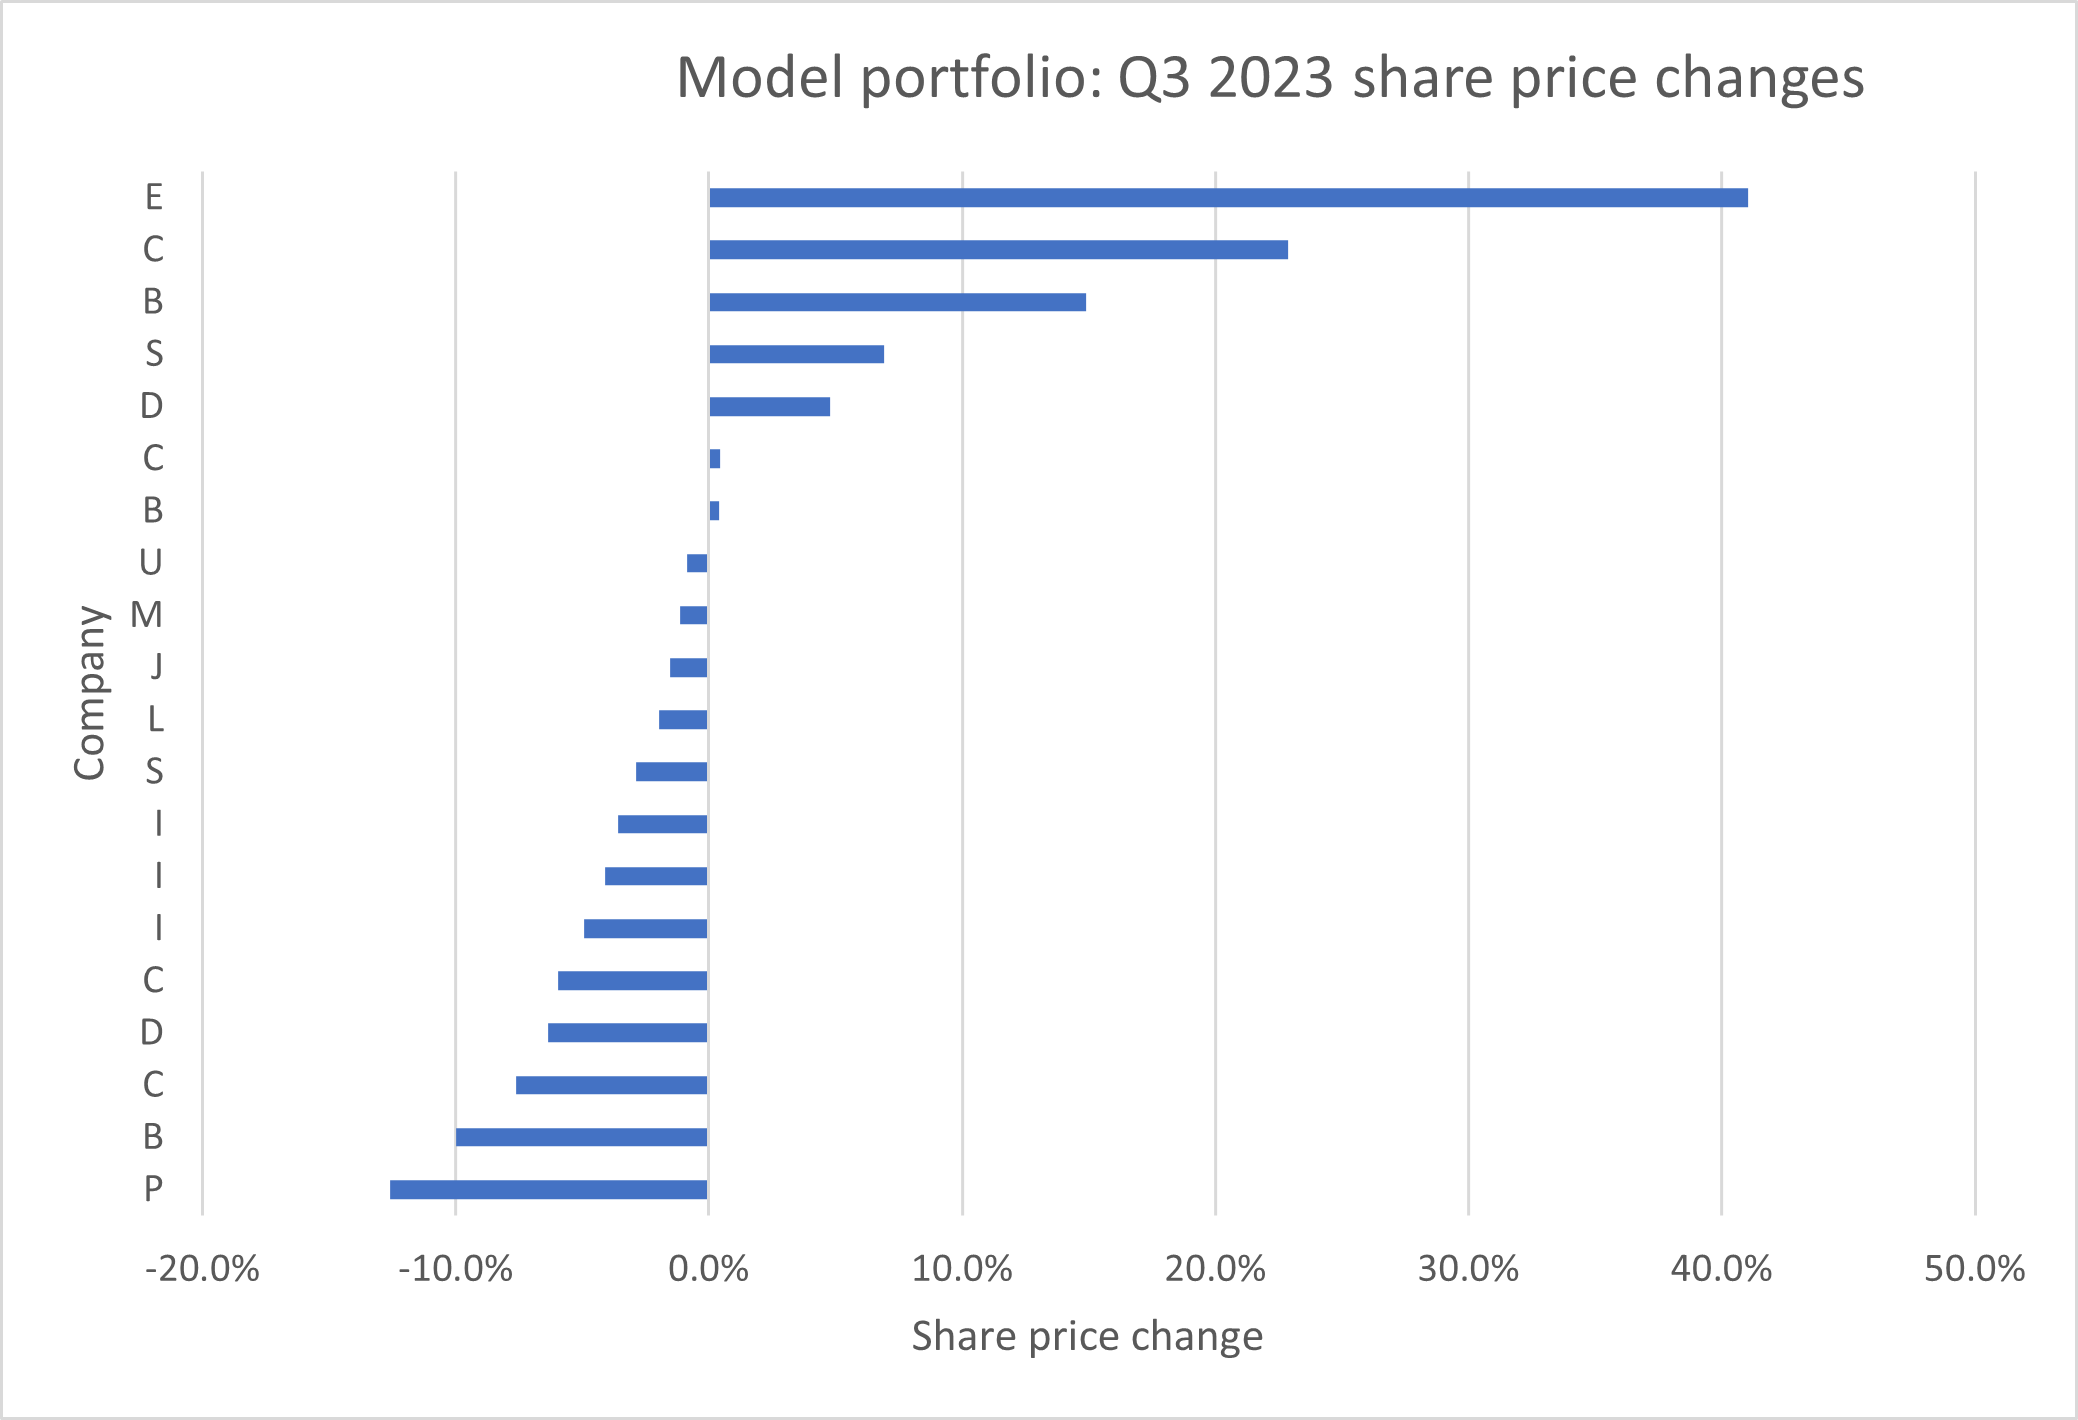
Of course, portfolio movements generally mask a much wider range of individual share price movements. Here's how the individual stocks in the model portfolio rose and fell during the third quarter of 2023:

The top two movers are the two shares that I sold at the end of the third quarter – see below.
All of the remainder were contained within a +/- 15% range for the quarter. In my view, this is fairly unremarkable and is typical of the short-term volatility equity investors need to be able to accept.
During this period, it's fair to say that the majority of my shares moved down, rather than up. But given the wider context of rising interest rates and poor investor sentiment, I don't think any of these movements are all that significant.
Although one or two companies issued somewhat downbeat results, there were no major problems reported during the quarter.
Stocks sold during Q3 2023
My slow trading policy allows me to make up to two changes to the model dividend portfolio each quarter. Unusually, for me, I maxed out this allowance in Q3, selling and replacing two shares.
The stocks sold were:
EMIS Group (LON:EMIS) - the UK competition regulator has finally approved the takeover of software group EMIS by Optum Health Solutions, which is a subsidiary of US healthcare giant UnitedHealth.
Having held onto my shares in case the bid failed, I decided it was time to release my capital and reinvest it in a new opportunity.
The model portfolio held EMIS from 01/12/21 to 29/09/23, generating a total return of 54% and an annualised return of 27%.
Concurrent Technologies (LON:CNC) - as I suggested in my July update, I have decided that this small-cap engineer is no longer a good fit in my model dividend portfolio.
Chief executive Miles Adcock may well be doing the right things. I think this could be a much bigger business in the future. But I think the short-term result of Adcock's aggressive focus on growth is that the dividend appears to have been deprioritised and the business is no longer as cash-generative as it was.
The model portfolio held Concurrent Technologies from 01/12/21 to 29/09/23, generating a total return of -6% and an annualised return of -3%.
New stocks & top-ups
To replace EMIS and Concurrent, I bought two new shares at the end of the quarter. Subscribers can find full details of both companies in these reviews, which were published during September:
- A FTSE 250 share I'm buying for dividends and growth
- New stock #2: another new share for my dividend portfolio
Model dividend portfolio: financial metrics
Stock picking is fascinating and potentially rewarding, but ultimately the only result that matters is the performance of my portfolio. This is one reason why I like to monitor the financial profile of my whole portfolio, as if it was a single company.
I find this a useful way to help make sure that I'm staying on track with my process and avoiding style drift.
Here's how my quality dividend model portfolio looked at the end of September 2023 (the half-year figures are here):
| Median mkt cap |
TTM ROCE | TTM EBIT yield |
TTM FCF yield |
Net debt/5yr avg net profit |
TTM div yield |
5yr avg div grth |
F'cast div yield |
No. yrs div paid |
| £1.7bn | 22.3% | 11.9% | 8.5% | 0.3x | 5.4% | 7.4% | 5.5% | 23 |
Data source: SharePad/author analysis 05/10/2023. Some adjustments were needed; please don't take this as gospel.
The portfolio stocks' average score in my dividend screen at the end of September 2023 was 70/100.
Comment: the portfolio's forecast dividend yield increased during the quarter to 5.5% (H1 2023: 5.0%). This was partly due to the changes I made at the end of the quarter, and partly due to falling share prices.
I'm happy with this level of yield – I'm not targeting the maximum possible income, as I also want to own shares with the capacity to reinvest earnings for growth. This isn't always the case with the highest-yielding stocks.
Looking back across the table, the portfolio's mid-cap bias (avg mkt cap £1.7bn) and average return on capital employed of more than 20% are largely unchanged from previous periods.
The trailing free cash flow yield of 8.5% indicates good support, in aggregate, for the portfolio's trailing dividend yield of 5.4%.
Dividend growth over the coming year seems likely to be lower than in recent years. However, I don't think that's surprising, given the impact of the recovery from pandemic cuts and the uncertain economic outlook at present.
Reassuringly, the companies in my portfolio have, on average, paid unbroken dividends for the last 23 years. Although this may have included some cuts, I believe this track record suggests that there is a strong corporate culture of dividend payments in these firms. That's one of the things I'm looking for.
Balance sheets remain strong, in aggregate, with net debt across the portfolio averaging less than 0.5 times five-year average net profit. In real terms, I think this is very low.
I'm broadly happy with the make-up of the portfolio and am looking forward (hopefully) to a more positive performance over the coming year.
As always, thank you for reading and supporting this project. Please feel free to get in touch with any questions or feedback – you can reach me by email or on X (Twitter).
Roland Head
Disclaimer: This is a personal blog/newsletter and I am not a financial adviser. All content is provided for information and educational purposes only. Nothing I say should be interpreted as investing advice or recommendations.
You should carry out your own research and make your own investing decisions. Investors who are not able to do this should seek qualified financial advice. Reasonable efforts are made to ensure that information provided is correct at the time of publication, but no guarantee is implied or provided. Information can change at any time and past articles are not updated.


