
H1 2024 quality dividend portfolio review: cash income up 22%
Dividend income from my model portfolio continued to rise in Q2 and is on track for full-year growth. However, capital gains lagged the FTSE 100, leaving room for improvement.


The model dividend portfolio delivered a record level of cash income during the first half of this year.
Payouts received (or ex-dividend) during H1 totalled almost 60% of the total income generated by the portfolio in 2023:
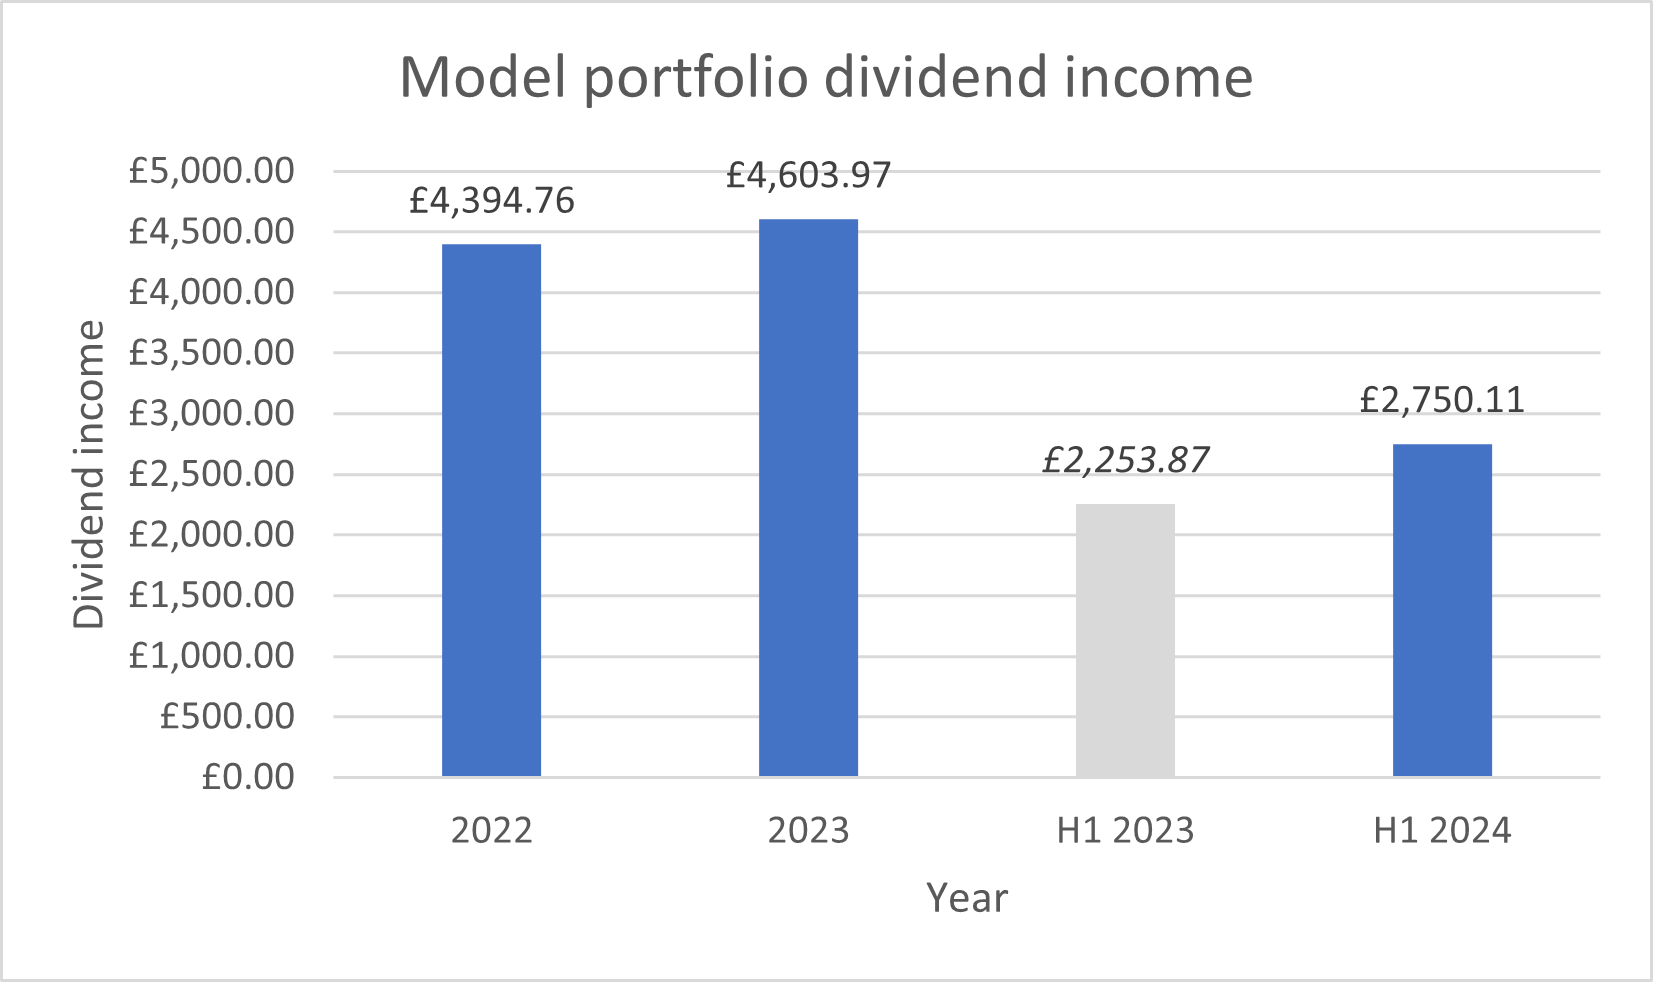
Dividends earned during the half year rose by 22% to £2,750, compared to the same period in 2023.
At the end of June, the average forecast dividend yield of the stocks in the model portfolio was 5%, compared to c.3.8% for the FTSE 100.
I'm comfortable the model portfolio is on track to deliver another year of inflation-beating income growth and market-beating yield in 2024.
Unfortunately, the capital (share price) performance of the portfolio continued to lag its FTSE 100 benchmark in Q2, albeit by a smaller margin than in Q1 2024.
Q2 2024 performance:
- RH model portfolio total return: 1.2%
- FTSE 100 Total Return index: 3.8%
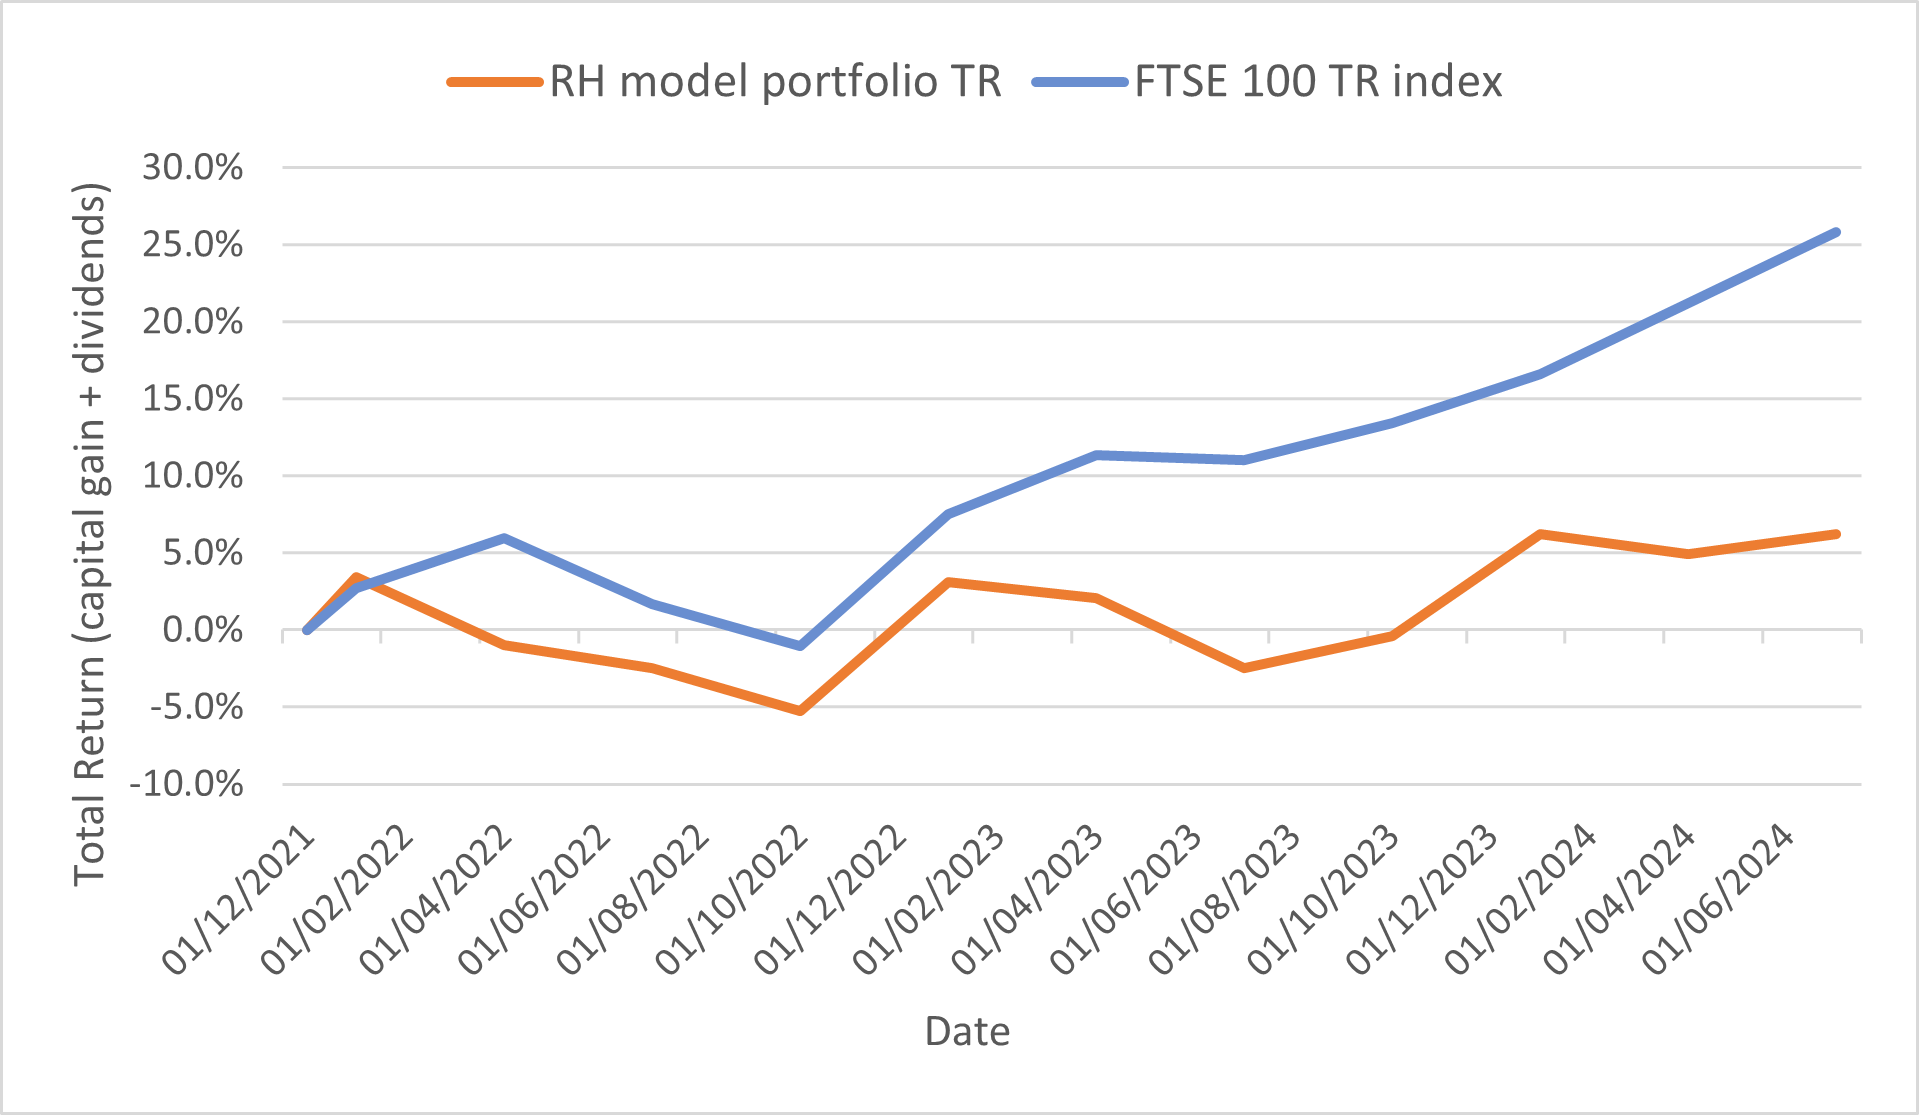
Even when dividends are included, the total return from my portfolio has still lagged the UK's main index so far this year:
H1 2024 performance:
- RH model portfolio total return: 0.0%
- FTSE 100 Total Return index: 7.9%
This slump is largely down to poor performances from a handful of stocks, as I discuss below. I'm hopeful that changes made to the portfolio this year will help me reverse this losing trend over time.
However, as a general rule, I think it's unrealistic for active investors to expect to track index movements neatly. In fact, this may not even be a desirable goal.
Why private investors rarely track the index
The FTSE 100's market-cap weighted index structure means that the share price movements of mega-caps such as Shell and AstraZeneca tend to have an outsized impact on the index.
I am only invested in one of the five largest companies in the FTSE 100 – but three of these giants delivered gains of more than 10% during H1, with only one recording a loss.
In total, I estimate that the share price movements of the five largest FTSE 100 stocks added around £50bn to the total market cap of the FTSE 100 in H1. That's roughly equivalent to the entire market cap of the 12 smallest companies in the index.
A company such as Rightmove (mkt cap £4.3bn) could go to zero and would have less impact on the FTSE 100 than a 2.5% gain for AstraZeneca (mkt cap £186bn).
This is not an excuse for the underperformance of my portfolio. But I think it is an explanation of why actively-managed portfolios are never likely to track market-cap weighted indices over short periods, unless they hold all the largest stocks in that index.
If that's the case, then it's worth considering whether the portfolio's (or funds) are really actively managed, or just closet index trackers.
Whatever its faults, my portfolio is definitely not a closet index tracker. I hold shares with market caps ranging from £100bn+ to c.£100m. Some are listed on the Main Market and some on AIM.
What they all share – I hope – is the ability to provide reliable dividends and deliver compound gains over long periods.
Read on for a summary of my portfolio's capital returns and dividend performance in H1, plus a review of its current financial profile and why this matters to me.
- H1 2024 portfolio performance
- Portfolio changes in Q2 2024
- Position weightings
- Portfolio: key financial metrics
- Final thoughts
H1 2024 portfolio performance review
The portfolio I'm discussing here is my quality dividend model portfolio, which is run using my dividend screening system.
This model portfolio was launched on 1 December 2021. It contains largely the same shares as my personal portfolio, which has been run on a similar basis for a number of years.
Although this is a dividend portfolio, no income is withdrawn and all dividends are reinvested. For this reason, my main metric for measuring progress against the wider market is total return (share price change + dividends).
This chart shows the performance of the portfolio against the FTSE 100 Total Return index since the model portfolio's inception on 1 December 2021:
As always, this seemingly bland performance disguises a wide range of individual share price movements during the quarter:
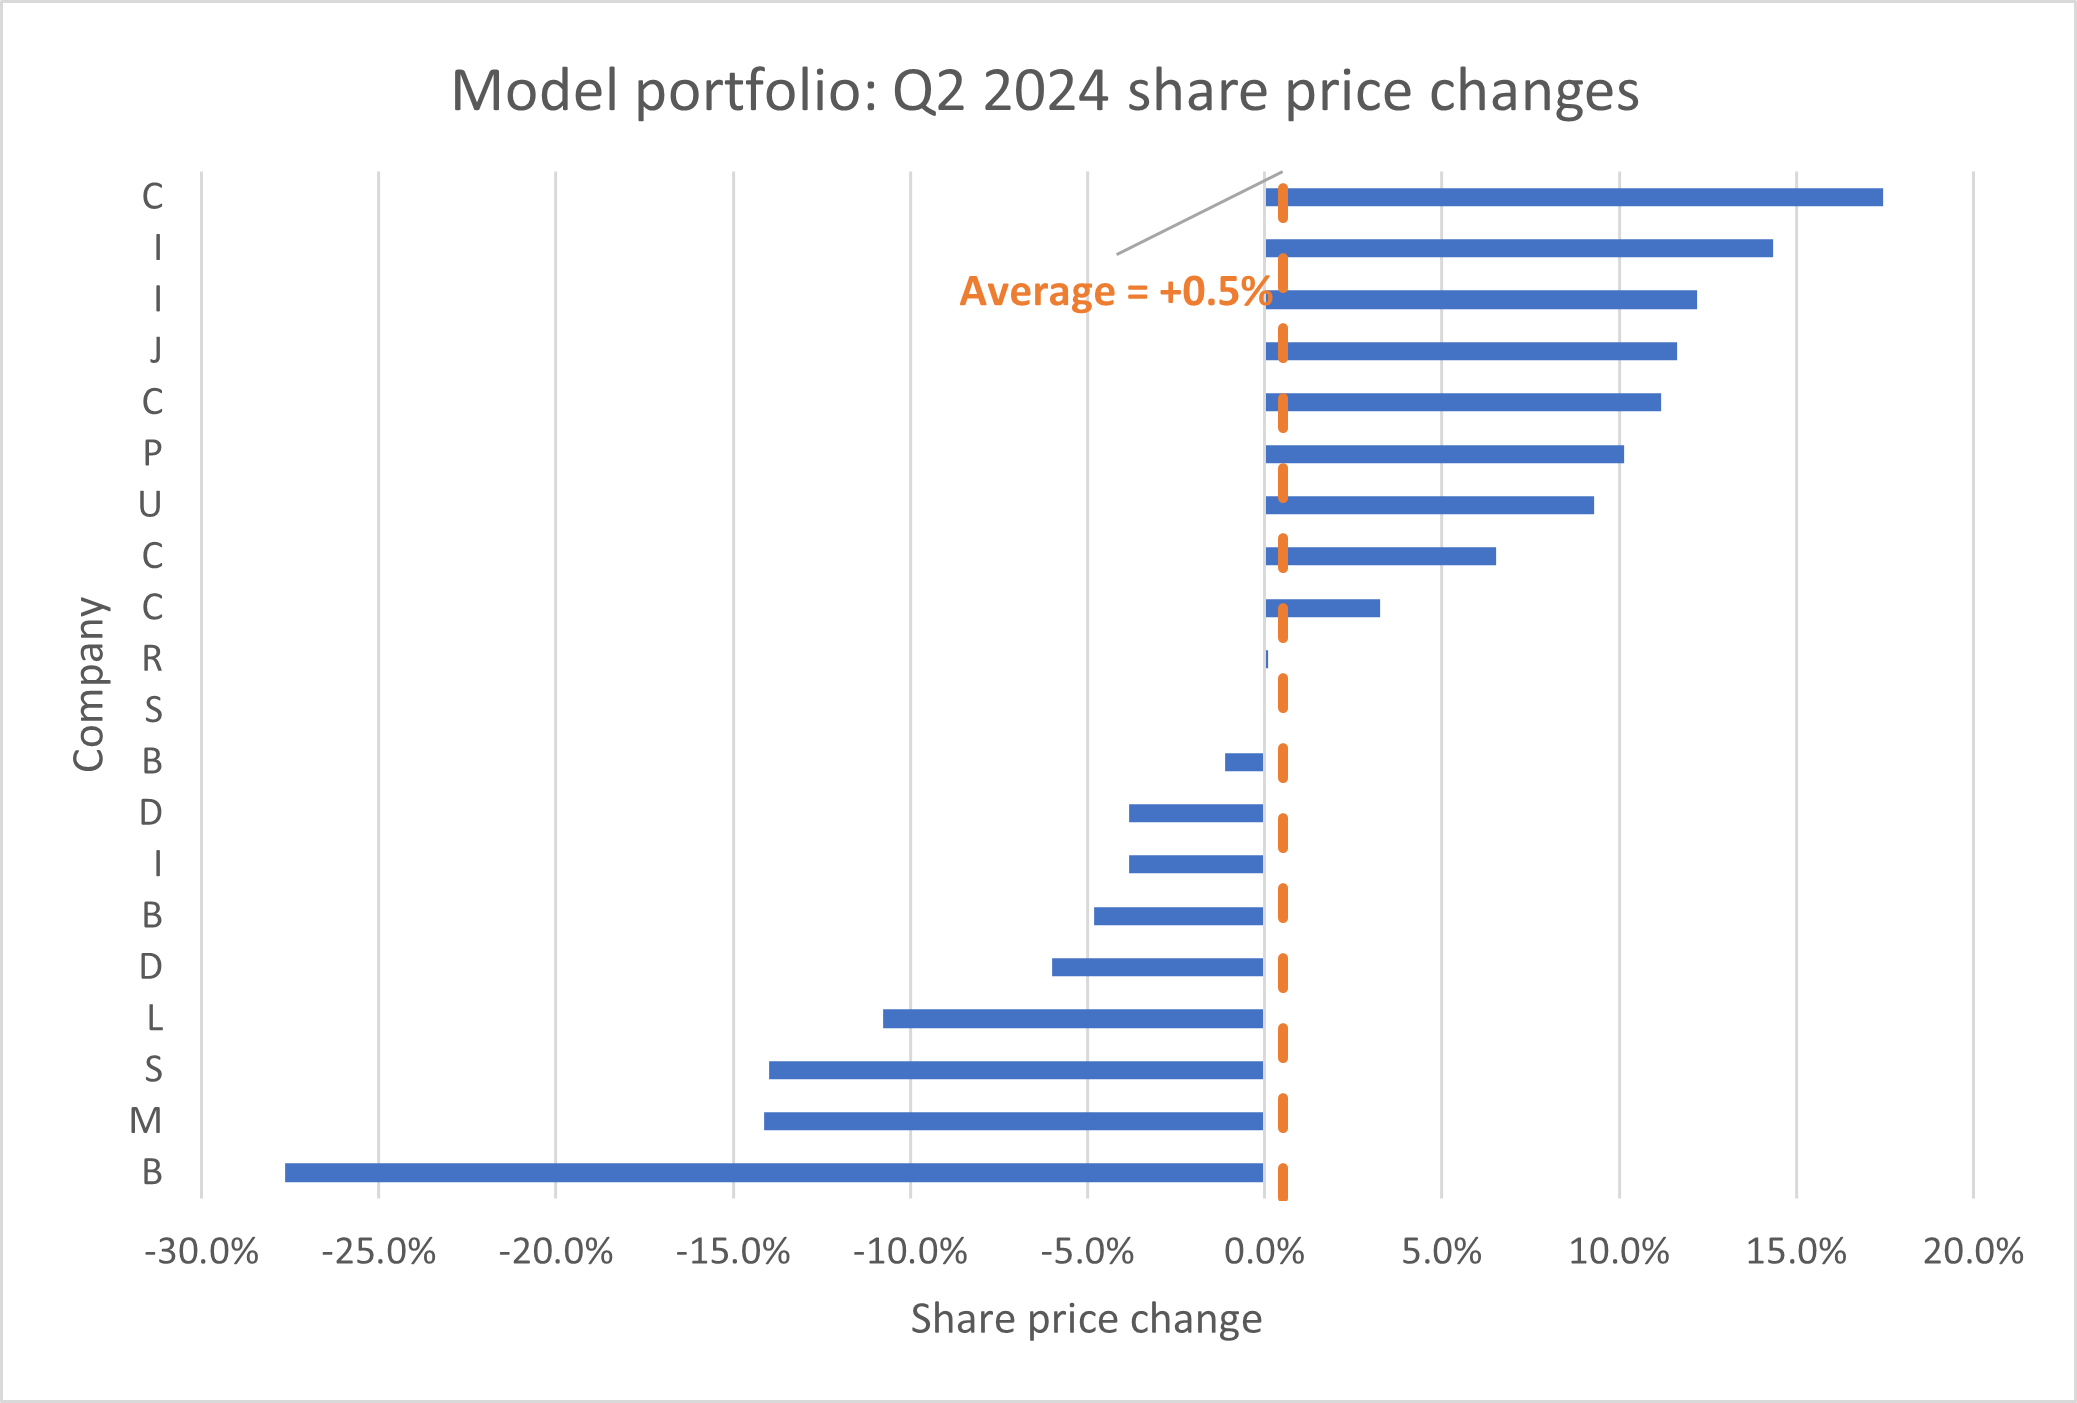
Volatility is part and parcel of equity investing. For all but the largest and most defensive stocks, I tend to view movements of less than 15%-20% during a quarter as relatively insignificant, unless they've been triggered by specific newsflow.
On that basis, only one of the fallers above is causing me concern. I reviewed the latest results from the company concerned – 'B' – in my May '24 portfolio review for subscribers.
Without going into too much detail, I believe the investment case for this business remains intact and should recover when sector conditions improve. I don't currently have any intention of selling this stock.
However, I did make one change to the portfolio during the second quarter.
Portfolio changes in Q2 2024
My slow trading policy allows me to make up to two changes to the model dividend portfolio at the end of each quarter.
In Q2, I sold one share and bought a replacement stock.
I did not top up any positions in Q2.
Stocks sold in Q2
June 2024: I sold a small-cap AIM stock at the end of June. I decided to sell because I felt the broader, unknowable risks attached to the investment outweighed the potential attraction of the operating business itself.
In simple terms, the shares were starting to keep me awake at night.
At the time of my decision, the company concerned was the smallest in my portfolio, by market cap.
A poor share price performance also meant that this position had shrunk to become the second smallest holding in the portfolio, at the time of my sale.
I decided it was logical to cut my losses. I closed the model portfolio's position for an overall loss of around 40%. My own real-money position closed for a similar loss.
I have reinvested the cash in a business that is simpler to analyse and which I expect to provide more reliable returns.
Subscribers can read a more detailed explanation of my sale – including the name of the company sold – here.
New stocks in Q2
June 2024: I added a new share to the portfolio to replace the company discussed above.
The company concerned is an AIM stock with family ownership and an impressive history of dividend growth. The balance sheet looks very strong to me and I believe this business has an excellent reputation and good scale in its market niche.
My analysis suggests that this company may also be in a position to enter a new phase of growth, when economic conditions improve.
I published a full write-up of this new purchase for subscribers here:
Both trades were made on 28 June 2024, the final trading day in the quarter.
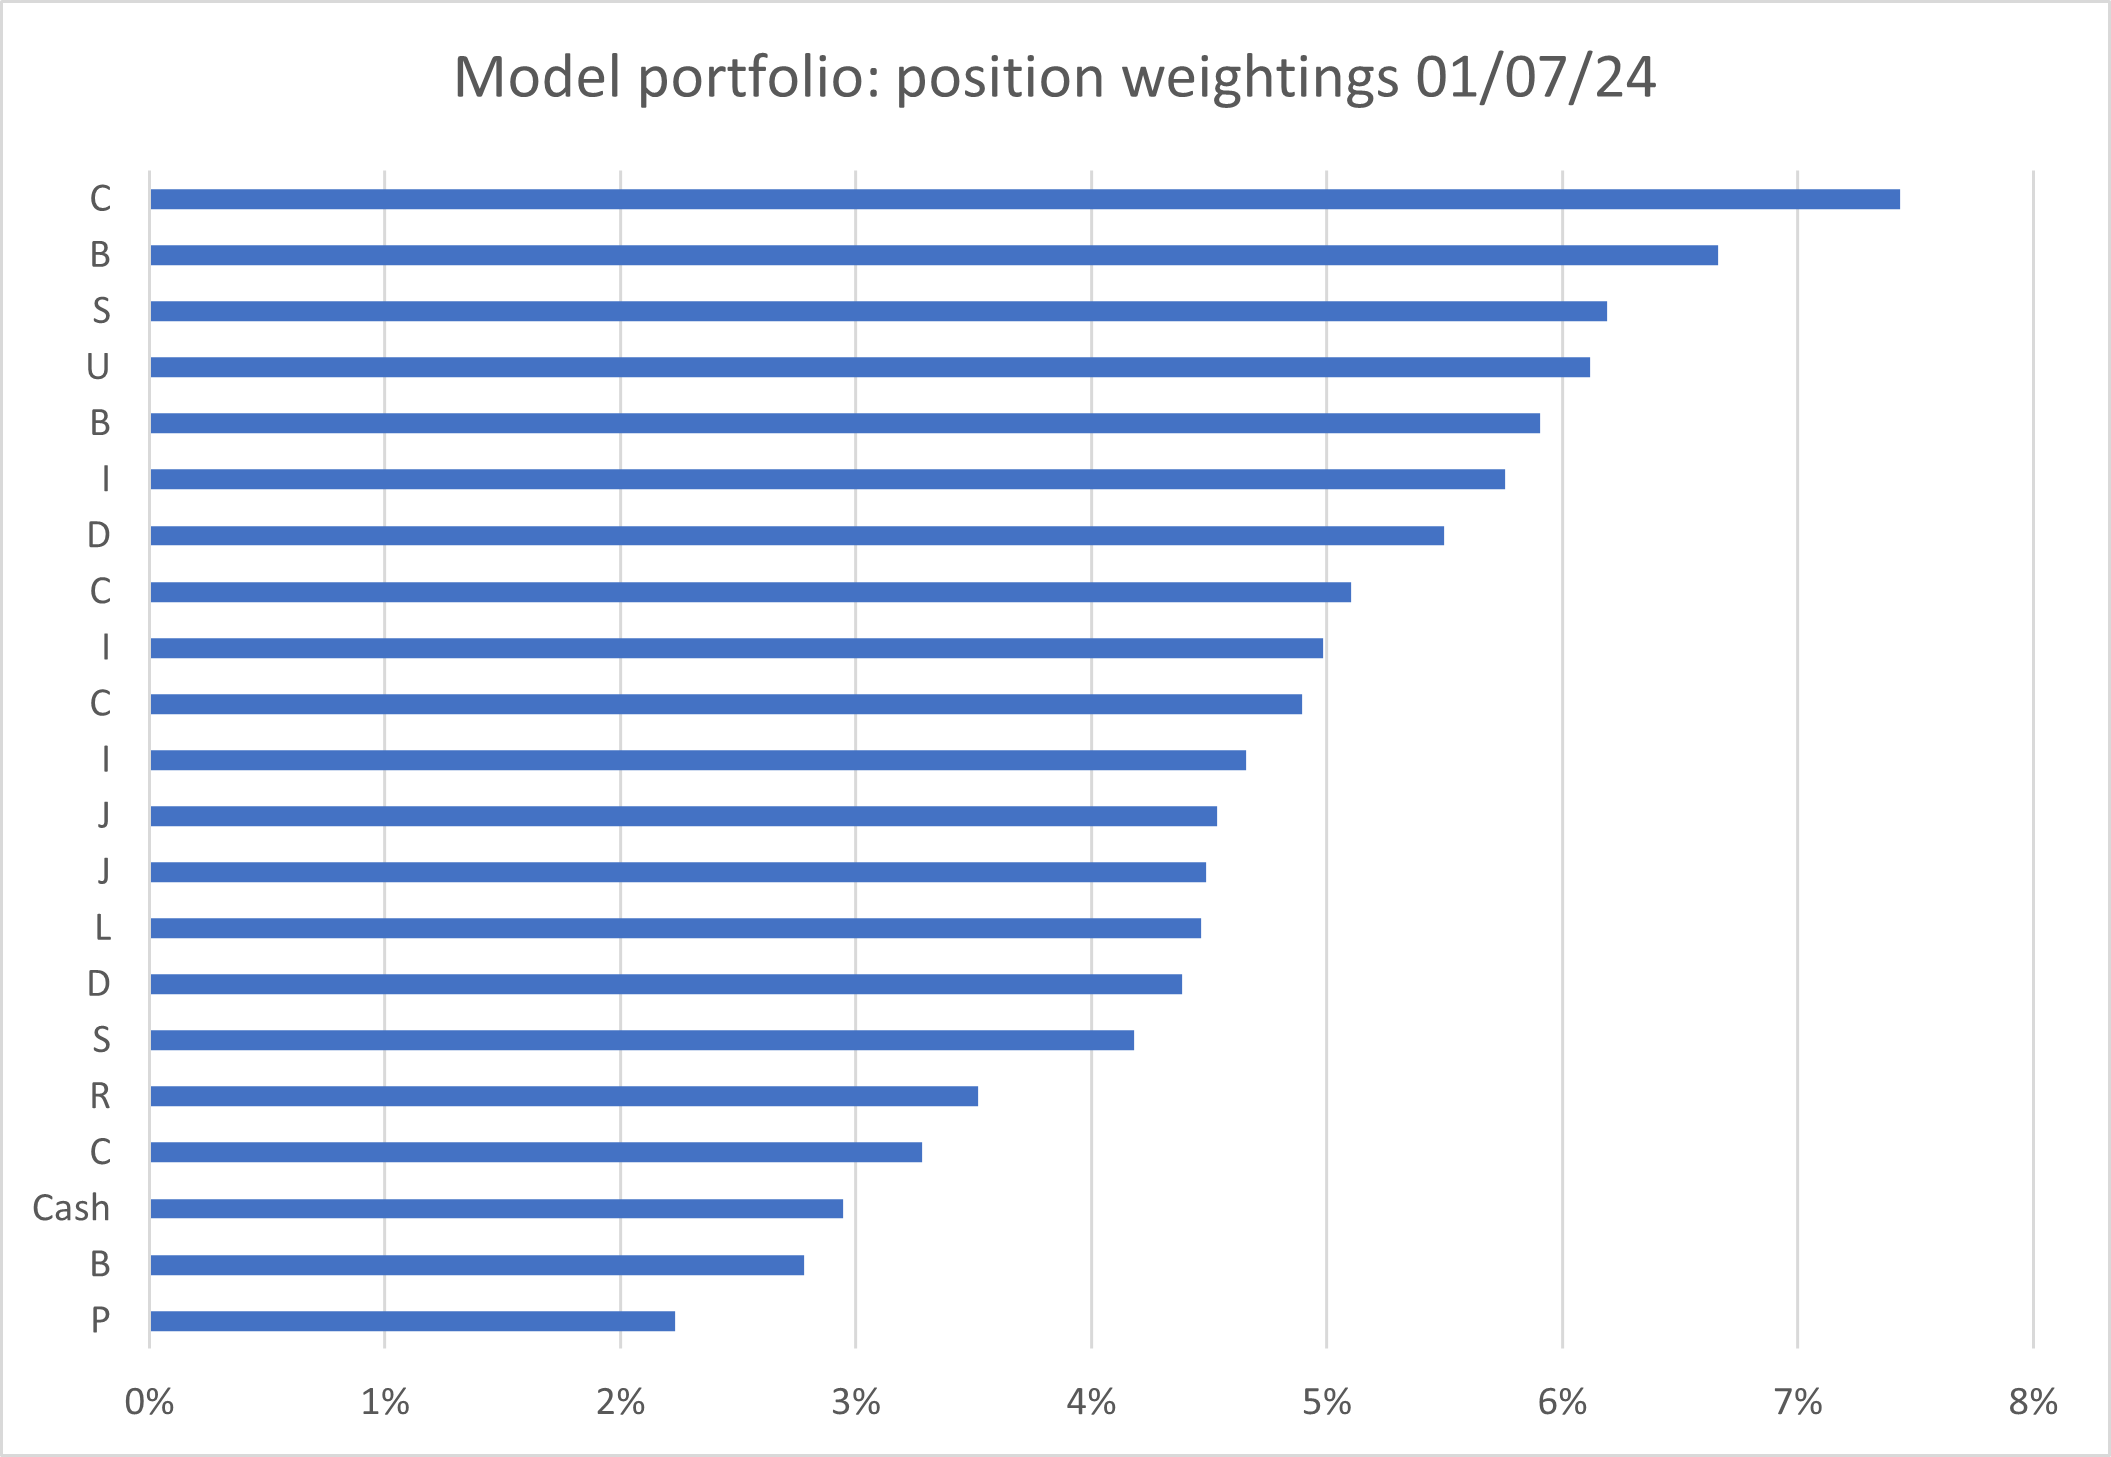
Position weightings
Here's how the model portfolio looked at the end of the first half of 2024, following the transactions discussed above. Subscribers can see this chart with ticker codes included on my portfolio page:
Model dividend portfolio: key financial metrics
For me, investing is all about the performance of my portfolio as a whole. As an engineer by training, I reckon my investment goals can be expressed in terms of inputs (which I provide) and outputs (which I hope to benefit from).
Inputs: I try to add quality companies with above-average profitability, strong financials and reliable dividends to the portfolio.
Outputs: I hope to receive a cash income that provides a market-beating yield and above-inflation dividend growth. I also hope for gradual capital appreciation over time. I expect this to follow naturally through a process of compounding, if my income and profitability inputs are maintained.
To help assess whether the portfolio is constructed in the way I wish, each quarter I take a look at some aggregate financial metrics for the entire portfolio.
In other words, I look at the portfolio as if it was a single business:
| Median mkt cap |
TTM ROCE | TTM EBIT yield |
TTM FCF yield |
Net debt/5yr avg net profit |
TTM div yield |
5yr avg div grth |
F'cast div yield |
No. yrs div paid |
| £2.7bn | 21.5% | 9.1% | 6.9% | 0.0x | 5.0% | 5.5% | 5.0% | 25 |
Scroll L-R (Data source: SharePad/author analysis 01/07/2024. Some adjustments were needed; please don't take this as gospel.)
Here's how these statistics looked at the end of Q1 2024
What do these numbers tell me?
One trend that's continued from the first quarter is that the median market cap has continued to rise, gaining a further 7% to £2.7bn (Q1 2024: £2.5bn). This reflects changes to the portfolio and some share price gains.
While I don't want to have a big cap portfolio, I am not worried about this increase. There are still plenty of smaller shares in the portfolio.
However, rising share prices (and in a few cases, falling earnings) mean that some of my stocks have become a little more expensive. This is reflected in the EBIT yield of 9.1% (Q1 '24: 10.0%) and FCF yield of 6.9% (Q1 '24: 8.0%).
While both figures still look decent value to me, they are not quite as cheap as three months ago.
Happily, the portfolio's trailing free cash flow yield of 6.9% remains comfortably ahead of its 5% dividend yield. This reassures me that the cash payouts I receive should be covered, at least in aggregate, by companies' surplus cash.
Profitability has not been affected either. The portfolio's average return on capital employed remains stable at c.21%, largely unchanged from Q1.
One possible concern is that the portfolio's forecast dividend yield and trailing 12-month dividend yield are both the same, at 5.0%. At face value, this suggests the portfolio will not provide any dividend growth this year.
In practice, I don't think this is likely. These yield figures have been affected by two portfolio changes so far this year and by special dividends. I still expect the actual income from the portfolio to increase this year, although there are no guarantees.
Even if cuts are necessary from time to time, I'm reassured by the strong dividend culture evidenced in the companies across the portfolio. On average, my shares have paid a dividend every year for the last 25 years – an increase from 24 years at the end of Q1.
Final thoughts
While I'm happy with the income performance of the portfolio, I am not happy with the capital returns it has generated.
So far this year, I have closed out two positions at a c.40% loss. This has limited the benefit of the positive total returns that have been delivered by the majority of shares in this 20-stock portfolio.
I guess this is a useful reminder of the importance of Warren Buffett's rule number one – "don't lose money".
Going forward, I'm aiming to improve my understanding of the risks inherent in the business I own. I also plan to put more effort into understanding both the valuation and the intrinsic value of the stocks I own and consider buying.
Until next time, thank you for reading – and good luck in the markets!
Roland Head
Disclaimer
This is a personal blog/newsletter and I am not a financial adviser. All content is provided for information and educational purposes only. Nothing I say should be interpreted as investing advice or recommendations.
You should carry out your own research and make your own investing decisions. Investors who are not able to do this should seek qualified financial advice. Reasonable efforts are made to ensure that information provided is correct at the time of publication, but no guarantee is implied or provided. Information can change at any time and past articles are not updated.


